Elite Supply Chains - Zara Part 2
In Part 2, we dive into the math behind Zara's hyper forecasting model, and how the risk aversion such an aggressive strategy actually manifests.
Nick
4/2/20255 min read

In Part 1, we explored how Zara’s biweekly product turnover creates a fundamental advantage in its ascent to the top of the retail space. Now let’s quantify how their brilliant scheme actually works mathematically, and all of the positive benefits that come from its strategy. We’ll take a generic retailer (Acme Clothing) and compare it to Zara’s supercharged fashion turnover strategy.
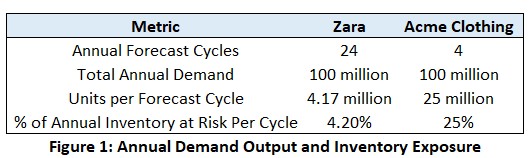
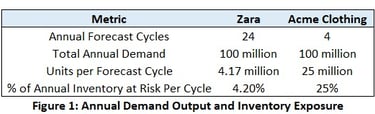
In the first figure, both companies have an equal annual target to hit 100 million units of clothing. The obvious difference being in how that demand is split up – 24 different fashion lines for Zara, versus four for Acme. Theoretically, if both companies hit their demand plan at a rate of 80%, on average nothing would change. Both companies would still have to solve for an additional 20 million units before scrapping or severely discounting it. Therin lies the problem with just looking at overall averages!
The key is Zara is deleveraging its risk by spreading it out across 24 different forecast cycles. The annual raw average is the same, but the probability of a single forecast failing is less detrimental for Zara than for Acme who has placed its bets on far fewer opportunities.
The Portfolio Effect and Independent Risk Events
You may have heard many financial advisors declare that it is safer to invest in the S&P 500 than trying to pick any of your favorite stocks. The portfolio effect, as it is called, is a real thing and leads to much better expected outcomes than any one individual stock. Apple may outperform the S&P 500 one quarter, and you may hit it big, but the probably of said event consistently occurring is less likely. Whereas the S&P 500 blends the good and bad quarters of all its corporations. The swings will not be as wild, but the chance to consistently grow in stable chunks quarter after quarter is as close to a guarantee as you can get in the stock market.
The same thinking can be applied to our forecast example. Zara basically places 24 small bets across a fiscal year. While the winnings from each bet are capped by the volume in their plan, more importantly the downside is also deleveraged, preventing any one off-the-mark fashion choice ruin their entire annual earnings. Mathematically we can measure this by predicting the standard deviation (or forecasting volatility) of both Zara and Acme.
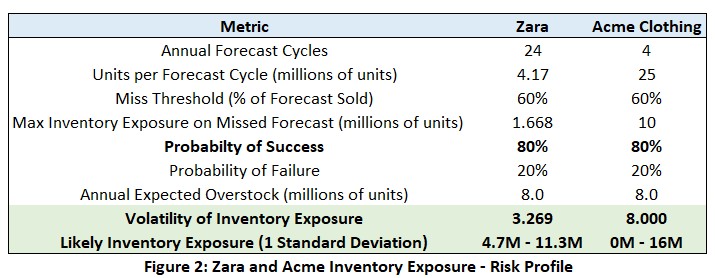
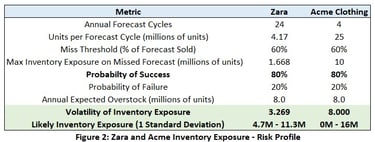
We will assume a binomial distribution – a fancy way of saying that both Zara and Acme will either achieve their forecast or fail. Let’s assume that both companies have 80% success rate and 20% failure rate in achieving their forecast targets. On average both Zara and Acme are expected to overstock about 8 million units. However, that 8-million-unit overstock is just the most common event of out an entire distribution of events that could potentially happen.
Acme
The band of outcomes is extremely wide for our fake clothing store. Their four forecast cycles sets Acme up for an all or nothing outcome. Looking at its likely inventory exposure (one standard deviation from the mean), Acme could either be perfect – and achieve 100% forecast accuracy, or be doomed and have to solve for more than 16 million units of unwanted clothing demand.
Zara
On the other hand, Zara is not set up to take any big bets, and as a result will never hit the lottery ticket that Acme has the ‘potential’ of doing – no inventory exposure. Instead, Zara accepts the reality that there will be some inventory exposure, but spreading it across 24 cycles guarantees that no one instance of failure will be crippling. Zara’s bell curve is much narrower, eliminating the extremes, including the daunting risk of ruin on the wrong side of the curve.
The Natural Self Improvement Phenomenon
The first example assumed both Zara and Acme had equal forecasting predictive power. In reality, I would suggest that is a faulty assumption. The beauty of Zara’s continuous iterative planning is it forces itself to quickly learn from past successes fand failures, thus doing better on each subsequent planning cycle. Their business model relies on constantly getting customer feedback, and that reliance feeds better planning as the feedback loop with the customer is always open. Its like Zara has a direct line into what’s trendy, and doesn’t wait for the market to tell it what is in vogue.
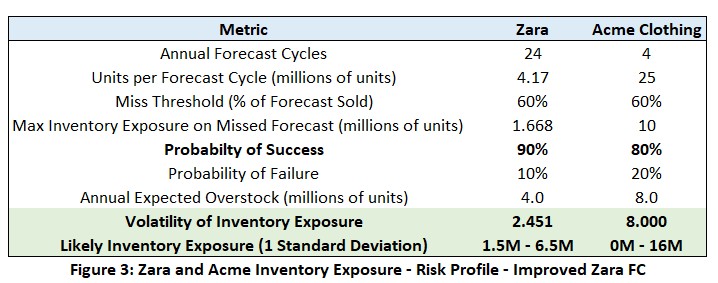
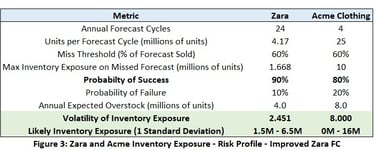
Miranda Priestly in “The Devil Wears Prada” hits the nail on the head when, I’m paraphrasing, she poignantly remarks how Andy’s frumpy blue sweater was selected for her by all the people in the room. If you both know what and can tell the customer what to want, your job becomes far easier. Therefore, perhaps a more accurate risk exposure profile for Zara would be pushing a 90% forecast accuracy – with so many more forecasting rounds of experience over Acme (and other real-life companies) – let’s see what happens when we update Zara’s success rate to 90%.
With a 10% bump in forecast accuracy, Zara’s inventory exposure falls by 4 million units on average, but more importantly the high end of the distribution is reduced to only 6.5M units of inventory exposure. Even if we carried the volatility out one more standard deviation (covering 95% of all likely outcomes) – it is well within the range of Zara having zero inventory exposure (matching Acme’s all or nothing approach). Combining Zara’s risk spread with continuous iteration with its customer base and trend setters all but guarantees its supply chain will not be left with a pile of unsolved garments at the end of a quarter.
The Real-World Competitive Advantage
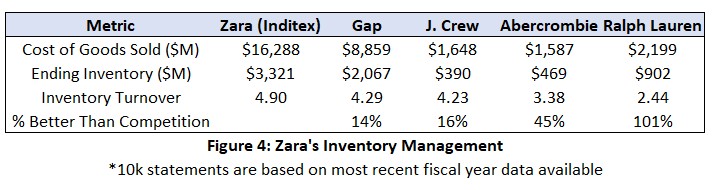
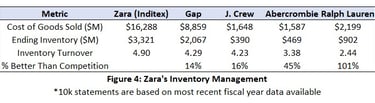
The mathematical advantages of Zara's forecasting model translate directly into measurable financial performance. As shown in Figure 4, Zara's inventory turnover ratio of 4.9 outperforms every major competitor in the fashion retail space. This means Zara turns its inventory into sales nearly 5 times per year: 14-16% faster than Gap and J. Crew, 45% faster than Abercrombie & Fitch, and more than twice as fast as Polo Ralph Lauren. This superior inventory efficiency creates a virtuous cycle of freed-up working capital that Zara can deploy strategically across its business.
Free Cash Flow For All Kinds of Possibilities
With less cash tied up in inventory, Zara enjoys greater financial flexibility to invest in strategic initiatives - whether that's prime retail locations, enhanced digital infrastructure, or more frequent marketing campaigns. While competitors strain their balance sheets carrying unsold inventory, Zara operates with a leaner, more responsive financial profile. The 24 mini-forecasts approach isn't just an operational strategy; it's a financial weapon that provides Zara additional ammunition to strengthen its market position quarter after quarter. In an industry where trends change rapidly and capital efficiency determines who thrives and who merely survives, Zara's forecasting model provides a sustained competitive advantage that's extraordinarily difficult for competitors to replicate. As we'll explore in Part 3, there are key elements of this approach that businesses of any size can adopt to improve their own inventory management and financial performance.